Finding a 5-year-old LuaJIT bug
LuaJIT#311 is the kind of bug report which compiler authors love: a relatively small self-contained file of code, which when fed through the compiler, does the wrong thing. The issue is now resolved, but I'd like to write about the thought process by which it was resolved.
With a bunch of code omitted for berevity, the issue claims that the following file, row.lua, is problematic:
-- ... lots of code ...

for i=0,100 do
  jit.flush()

  r=TIntArrayNative.new{ 0,1,2,-1,-2,-3 }
  res=ff( TIntArrayNative.new{ 1,2,3,2,1,0 } )
  assert( cEql(r, res), 'ff1 failed' )

  r=TIntArrayNative.new{ 0,0,0 }
  res=ff( TIntArrayNative.new{ 0, 0, 0 } )
  assert( cEql(r, res), 'ff2 failed' )

  r=TIntArrayNative.new{ 0,1,-1 }
  res=ff( TIntArrayNative.new{ 0, 1, 0 } )
  assert( cEql(r, res), 'ff3 failed' )

  r=TIntArrayNative.new{ 0,-1,-2,-3, 1,2,3 }
  res=ff( TIntArrayNative.new{ 0,-1,-2,-4,0,1,2 } )
  assert( cEql(r, res), 'ff4 failed' )
end
From this code, we can conclude that the issue isn't perfectly reproducible (hence the 100-iteration loop), and that the issue only affects some traces and not others (the call to jit.flush at the top of loop will result in LuaJIT sometimes choosing to compile different traces on each iteration). Bearing this in mind, trying to reproduce the issue was often fruitless:
$ luajit.exe row.lua && echo OK
OK
But, sometimes, an issue would present itself:
$ luajit.exe row.lua && echo OK
luajit.exe: row.lua:199: ff4 failed
stack traceback:
        [C]: in function 'assert'
        row.lua:199: in main chunk
        [C]: at 0x7ff61f3c1eb0
Given the proportion of times the issue didn't appear, "not perfectly reproducible" was perhaps an understatement, so increasing reproducibility was the first priority. To begin, the -jdump=t flag can give an idea of what code get selected for tracing - the output is along the lines of:
$ luajit.exe -jdump=t row.lua
---- TRACE flush

---- TRACE 1 start row.lua:69
---- TRACE 1 stop -> return

---- TRACE flush

---- TRACE 1 start row.lua:107
---- TRACE 1 stop -> loop

---- TRACE 2 start row.lua:69
---- TRACE 2 stop -> return

---- TRACE flush

---- TRACE 1 start row.lua:74
---- TRACE 1 stop -> return

---- TRACE 2 start row.lua:69
---- TRACE 2 stop -> return

---- TRACE 3 start row.lua:170
---- TRACE 3 abort row.lua:175 -- leaving loop in root trace

---- TRACE flush

---- TRACE 1 start row.lua:107
---- TRACE 1 stop -> loop

---- TRACE 2 start row.lua:145
---- TRACE 2 stop -> loop

---- TRACE flush

---- TRACE 1 start row.lua:69
---- TRACE 1 stop -> return

---- TRACE 2 start row.lua:170
---- TRACE 2 stop -> loop
Now comes the game of deciding which trace site to investigate. The traces which finish with stop -> return are less interesting than the traces which finish with stop -> loop (as looping traces have more opportunities for mischief). With that in mind, the row.lua:107 loop is:
      for _,v in ipairs(n) do
        a[k] = v
        k = k + 1
      end
The row.lua:145 loop is:
  for i=1,#a do
    if a[i] > a[i-1] then
      if r[i-1] > 0 then
        r[i] = r[i-1] + 1
      else
        r[i] = 1
      end
    end

    if a[i] < a[i-1] then
      if r[i-1] < 0 then
        r[i] = r[i-1] - 1
      else
        r[i] = -1
      end
    end
  end
The row.lua:170 loop is:
  for i=0,#a1 do
    if a1[i] ~= a2[i] then
      return false
    end
  end
Of these three loops, row.lua:145 contains the most branches, and therefore is the most likely to sometimes have LuaJIT end up choosing a different sequence of branch directions to trace. Given the hypothesis that branch choice is crucial to the issue, this seemed like a good loop to focus on. One way to focus on it is to prevent JIT compilation of other things (by means of jit.on() and jit.off()), and then to play around with JIT compiler parameters relating to trace selection, eventually stumbling upon this:
@@ -142,6 +142,8 @@ end
 function ff(a)
   local r=TIntArrayNative.new(#a)

+  jit.opt.start("hotloop=2")
+  jit.on()
   for i=1,#a do
     if a[i] > a[i-1] then
       if r[i-1] > 0 then
@@ -159,6 +161,7 @@ function ff(a)
       end
     end
   end
+  jit.off()

   return r
 end
With this diff in place, the issue becomes reproducible every time, and the next stage of investigation can begin - by which I mean the level of data dumping can be increased from -jdump=t all the way up to -jdump=bitmsrx:
$ luajit.exe -jdump=bitmsrx row.lua
---- TRACE flush

---- TRACE 1 start row.lua:69
... some bytecode ...
---- TRACE 1 IR
... some IR ...
---- TRACE 1 mcode 184
... some machine code ...
---- TRACE 1 stop -> return

---- TRACE 2 start row.lua:147
... lots of bytecode ...
---- TRACE 2 IR
... lots of IR ...
0039 ------------ LOOP ------------
... more IR ...
---- TRACE 2 mcode 225
... lots of machine code ...
---- TRACE 2 stop -> loop

---- TRACE 2 exit 4
---- TRACE 2 exit 4
---- TRACE 3 start row.lua:74
... some bytecode ...
---- TRACE 3 IR
... some IR ...
---- TRACE 3 mcode 108
... some machine code ...
---- TRACE 3 stop -> return

---- TRACE 3 exit 0
---- TRACE 3 exit 0
---- TRACE 3 exit 0
---- TRACE 3 exit 0
---- TRACE 3 exit 0
---- TRACE 3 exit 0
---- TRACE 2 exit 2
---- TRACE 2 exit 2
---- TRACE 3 exit 0
---- TRACE 3 exit 0
---- TRACE 3 exit 0
---- TRACE 3 exit 0
---- TRACE 4 start 3/0 row.lua:75
... some bytecode ...
---- TRACE 4 IR
... some IR ...
---- TRACE 4 mcode 99
... some machine code ...
---- TRACE 4 stop -> return

---- TRACE 2 exit 1
---- TRACE 2 exit 5
---- TRACE 2 exit 7
---- TRACE 2 exit 1
---- TRACE 2 exit 1
luajit.exe: row.lua:202: ff4 failed
stack traceback:
  [C]: in function 'assert'
  row.lua:202: in main chunk
  [C]: at 0x0100001440
The loop of interest has become TRACE 2, and some of the metamethods it invokes have become TRACE 1, TRACE 3, and TRACE 4. After a quick look over the IR of all these traces, it was the IR of TRACE 2 which caught my attention:
---- TRACE 2 IR
....              SNAP   #0   [ ---- ]
0001 rax   >  int SLOAD  #4    CRI
0002       >  int LE     0001  +2147483646
0003 rbp      int SLOAD  #3    CI
0004 r10   >  cdt SLOAD  #1    T
0005          u16 FLOAD  0004  cdata.ctypeid
0006       >  int EQ     0005  +102
0007          p64 ADD    0004  +8
0008 rdx      p64 XLOAD  0007
0012          i64 BSHL   0003  +3
0013          p64 ADD    0012  0008
0014          p64 ADD    0013  +8
0015 r8       i64 XLOAD  0014
0019 r9       i64 XLOAD  0013
....              SNAP   #1   [ ---- ---- ---- 0003 0001 ---- 0003 ]
0021       >  i64 GE     0019  0015
....              SNAP   #2   [ ---- ---- ---- 0003 0001 ---- ---- ]
0022       >  i64 GT     0019  0015
....              SNAP   #3   [ ---- ---- ---- 0003 0001 ---- 0003 ]
0023 rsi   >  cdt SLOAD  #2    T
0024          u16 FLOAD  0023  cdata.ctypeid
0025       >  int EQ     0024  +102
0026          p64 ADD    0023  +8
0027 rcx      p64 XLOAD  0026
0031          p64 ADD    0027  0012
0032          i64 XLOAD  0031
....              SNAP   #4   [ ---- ---- ---- 0003 0001 ---- 0003 ]
0034       >  i64 GE     0032  +0
0035          p64 ADD    0031  +8
0036          i64 XSTORE 0035  -1
0037 rbp    + int ADD    0003  +1
....              SNAP   #5   [ ---- ---- ---- ]
0038       >  int LE     0037  0001
....              SNAP   #6   [ ---- ---- ---- 0037 0001 ---- 0037 ]
0039 ------------ LOOP ------------
0040          i64 BSHL   0037  +3
0041          p64 ADD    0040  0008
0042          p64 ADD    0041  +8
0043 rbx      i64 XLOAD  0042
0044 r15      i64 XLOAD  0041
....              SNAP   #7   [ ---- ---- ---- 0037 0001 ---- 0037 ]
0045       >  i64 GE     0044  0043
....              SNAP   #8   [ ---- ---- ---- 0037 0001 ---- 0037 ]
0046       >  i64 GT     0044  0043
0047          p64 ADD    0040  0027
0048          p64 ADD    0047  +8
0049          i64 XSTORE 0048  -1
0050 rbp    + int ADD    0037  +1
....              SNAP   #9   [ ---- ---- ---- ]
0051       >  int LE     0050  0001
0052 rbp      int PHI    0037  0050
---- TRACE 2 mcode 225
This being a looping trace, all of the instructions before -- LOOP -- should correspond to one iteration of the loop, and similarly all of the instructions after -- LOOP -- should correspond to one iteration of the loop (the difference being that the second set of instructions can rely on a bunch of assumptions and invariants set up by the first set of instructions, and thus can be shorter and more efficient). For example, 0012 i64 BSHL 0003 +3 and 0040 i64 BSHL 0037 +3 represent the same thing (namely, the multiplication of i by 8 as part of array indexing). Similarly, 0021 > i64 GE 0019 0015 and 0045 > i64 GE 0044 0043 both represent the > in if a[i] > a[i-1] then, and 0022 > i64 GT 0019 0015 and 0046 > i64 GT 0044 0043 both represent the < in if a[i] < a[i-1] then.
The thing which jumped out at me was 0034 > i64 GE 0032 +0 (which comes from the < in if r[i-1] < 0 then), which has no corresponding instruction after -- LOOP --. In other words, LuaJIT concluded that it only needed to check r[i-1] < 0 was false once, and that thereafter, it could assume r[i-1] < 0 was false without needing to check. The question became: why did LuaJIT conclude this?
To answer this question, attention moved to the implementation of LuaJIT's "LOOP" optimisation (in lj_opt_loop.c), and in particular the part which emits all of the instructions after -- LOOP --:
/* Copy and substitute all recorded instructions and snapshots. */
for (ins = REF_FIRST; ins < invar; ins++) {
  ...
  /* Substitute instruction operands. */
  ir = IR(ins);
  op1 = ir->op1;
  if (!irref_isk(op1)) op1 = subst[op1];
  op2 = ir->op2;
  if (!irref_isk(op2)) op2 = subst[op2];
  if (irm_kind(lj_ir_mode[ir->o]) == IRM_N &&
      op1 == ir->op1 && op2 == ir->op2) {
    subst[ins] = (IRRef1)ins;  /* Shortcut. */
  } else {
    /* Re-emit substituted instruction to the FOLD/CSE/etc. pipeline. */
    IRType1 t = ir->t;
    IRRef ref = tref_ref(emitir(ir->ot & ~IRT_ISPHI, op1, op2));
    subst[ins] = (IRRef1)ref;
    ...
  }
}
The key parts of this code are:
for (ins = REF_FIRST; ins < invar; ins++), which loops over all instructions prior to-- LOOP --.emitir(ir->ot & ~IRT_ISPHI, op1, op2), which either emits an instruction, or emits a new constant, or finds a previously-emitted equivalent instruction or constant.- Assigning to
substafter emitting an instruction, and reading fromsubstwhen said instruction appears as an operand to a later instruction.
To see what happened to 0034 > i64 GE 0032 +0, a conditional breakpoint can be set on the ir = IR(ins) line (with the condition being J->cur.traceno == 2 && ins == REF_BASE + 34):
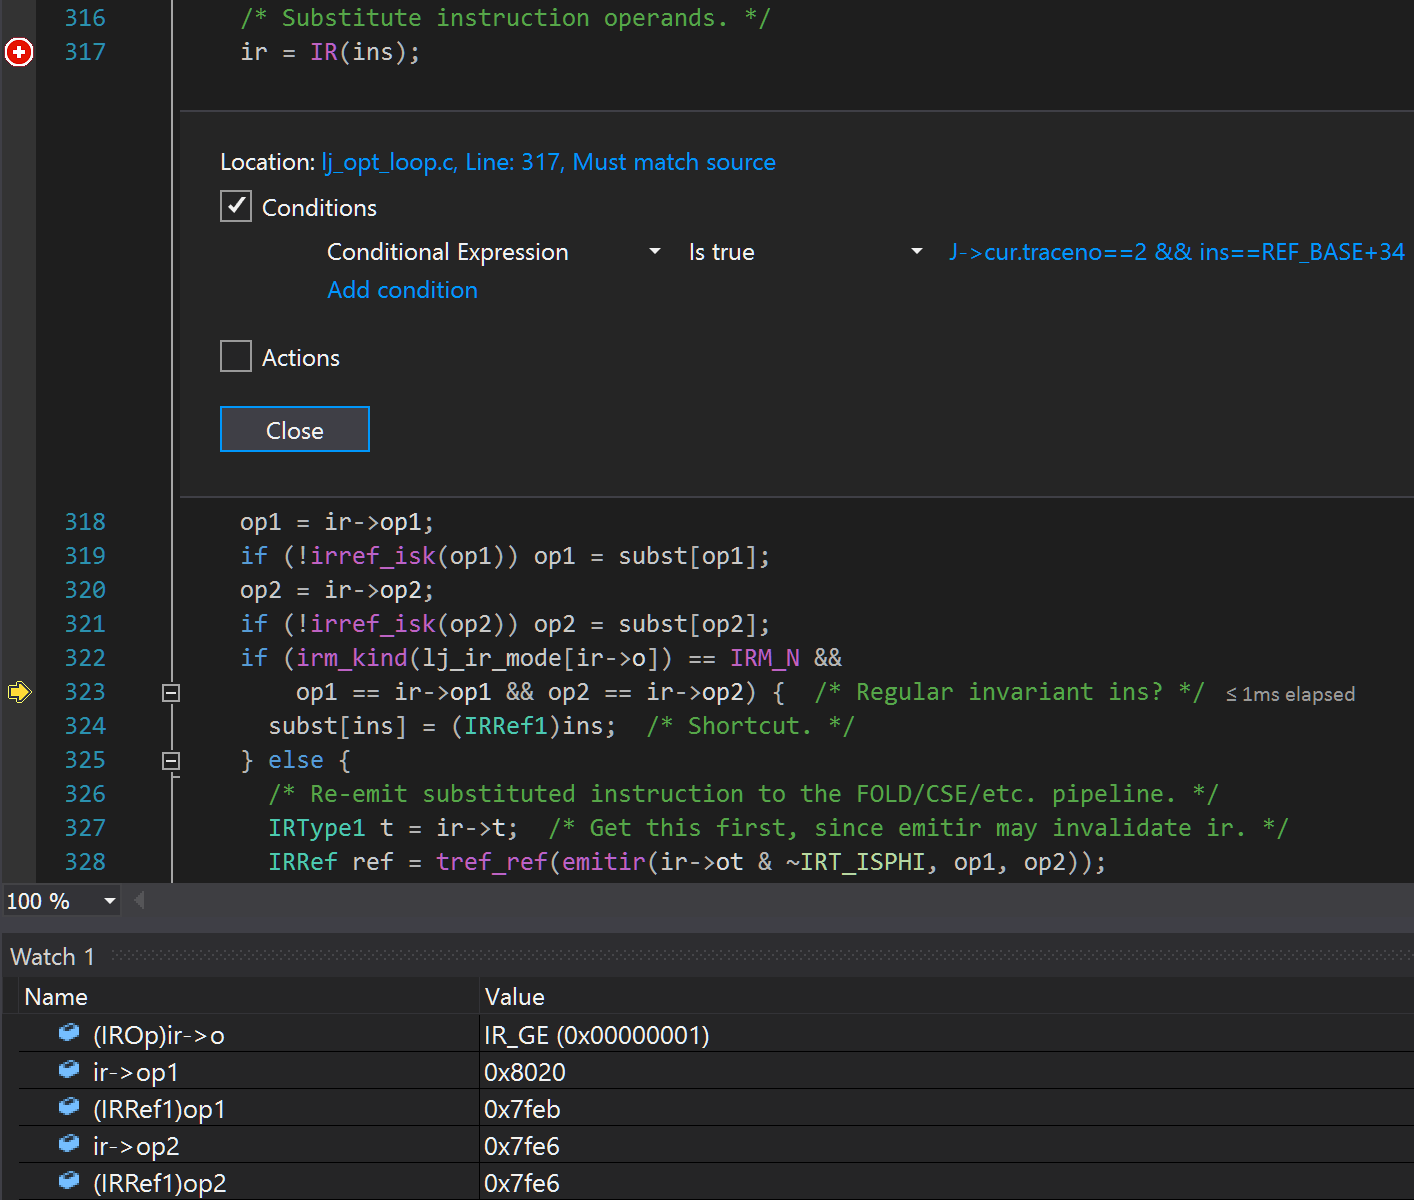
The instruction's opcode ((IROp)ir->o) is GE, as expected. The original left-hand operand (ir->op1) is 0x8020, which after dropping the 8 and converting the 20 from hex to decimal, gives 0032, as expected. The remaining watches are less obvious: they're all less than 0x8000, which means that they are constants rather than instructions. Knowing that they happen to be 64-bit signed integer constants, their values are just another watch away:
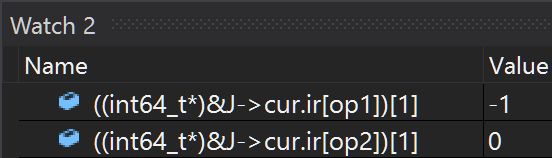
This shows that the right-hand operand (op2) is the constant 0, as expected. Furthermore, LuaJIT thinks that the left-hand operand (op1) is the constant -1. Given that the original source code was r[i-1] < 0, this might seem slightly surprising, but it is in fact LuaJIT being clever: the previous loop iteration did r[i] = -1 (this is 0036 i64 XSTORE 0035 -1 in the IR), and i increments by one on each iteration (this is 0037 rbp + int ADD 0003 +1 / 0050 rbp + int ADD 0037 +1 / 0052 rbp int PHI 0037 0050 in the IR), and so LuaJIT is correct to conclude that on this iteration, r[i-1] is -1 (reaching this conclusion requires quite a lot of cleverness around re-assocation and forwarding and aliasing, but that's a story for another day).
So, at this point, everything is lined up for emitir to emit (or find or etc) the instruction int64_t(-1) >= int64_t(0). Given both operands are constants, this instruction should get constant-folded, and indeed emitir ends up at fold_kfold_int64comp from lj_opt_fold.c:
/* Special return values for the fold functions. */
enum {
  ...
  FAILFOLD,   /* Guard would always fail. */
  DROPFOLD,   /* Guard eliminated. */
  ...
};
...
#define CONDFOLD(cond)  ((TRef)FAILFOLD + (TRef)(cond))
...
LJFOLD(LT KINT64 KINT64)
LJFOLD(GE KINT64 KINT64)
LJFOLD(LE KINT64 KINT64)
LJFOLD(GT KINT64 KINT64)
LJFOLD(ULT KINT64 KINT64)
LJFOLD(UGE KINT64 KINT64)
LJFOLD(ULE KINT64 KINT64)
LJFOLD(UGT KINT64 KINT64)
LJFOLDF(kfold_int64comp)
{
#if LJ_HASFFI
  uint64_t a = ir_k64(fleft)->u64, b = ir_k64(fright)->u64;
  switch ((IROp)fins->o) {
  case IR_LT: return CONDFOLD(a < b);
  case IR_GE: return CONDFOLD(a >= b);
  case IR_LE: return CONDFOLD(a <= b);
  case IR_GT: return CONDFOLD(a > b);
  case IR_ULT: return CONDFOLD((uint64_t)a < (uint64_t)b);
  case IR_UGE: return CONDFOLD((uint64_t)a >= (uint64_t)b);
  case IR_ULE: return CONDFOLD((uint64_t)a <= (uint64_t)b);
  case IR_UGT: return CONDFOLD((uint64_t)a > (uint64_t)b);
  default: lua_assert(0); return FAILFOLD;
  }
#else
  UNUSED(J); lua_assert(0); return FAILFOLD;
#endif
}
Any sane person should conclude that int64_t(-1) >= int64_t(0) is false (FAILFOLD), but if you follow the code in the above snippit, you'll see that it returns DROPFOLD (true) for int64_t(-1) IR_GE int64_t(0), because it always does unsigned comparison. Therein lies the bug: the four instructions with U in their name are meant to do unsigned comparison, but the four instructions without U in their name are meant to do signed comparison. At runtime, they do indeed do this, but at constant-folding-time, the signed comparisons do the wrong thing if one operand is negative and the other is non-negative.
The fix is simple: have fold_kfold_int64comp perform signed comparisons for the four instructions which represent signed comparisons.